Newmarket Hill is dead:
Long live Castle Hill!
I find it sad that modern surveying has demoted Newmarket Hill. However, Castle Hill is a worthy successor.
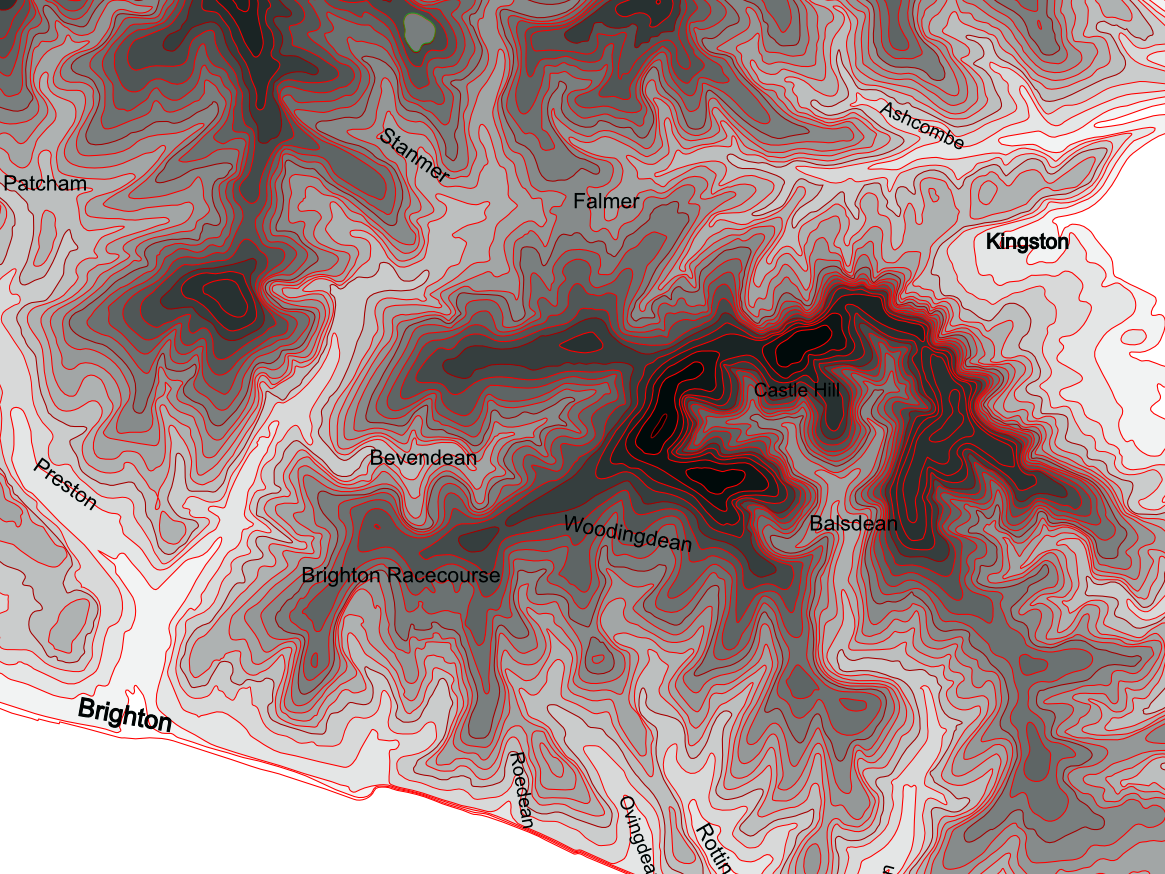
The ‘Hill Bagging‘ website is the online version of the Database of British and Irish Hills (DoBIH). It is as near to official as one can find. If they say that Castle Hill is now considered to be higher than Newmarket Hill (about a mile to its west-south-west) I am willing to accept that it is so.
What has happened?
It appears from the DoBIH Change Log that Castle Hill has not grown in height, it is still considered to be 199.8 metres (656ft) high. However, Newmarket Hill’s DoBIH Change Log records that its measured height, in May 2020, has shrunk by 2 feet, from 200 metres (656ft) 199.4 metres (654ft).
I can think of two possible reasons:
- Surveying errors
- Soil erosion.
My personal belief is that soil erosion due to ploughing may have been a major factor. Castle Hill has been put down to grass — improved pasture. The grass, bramble and nettle cover across the demolished remains of Newmarket Farm had enabled the build up of about 5 centimetres (2 inches) of soil in about 60 years.
However, Newmarket Hill has been under the plough for many years. The sub-surface geology identified from our excavation of Newmarket Farm in 2013, located a short distance from the hill’s major and minor summits, was of a reddish-orange silty clay (clay-with-flints), at least two feet deep (we didn’t excavate deeper). This is reddish coloured acid clay is found on most of the broad backed hills in this area and can be up to 10 metres deep (South Downs Integrated Landscape Character Assessment: Technical Report by Land Use Consultants, December 2005, p. 10). It accounts for the presence of such acid loving plants as sheep sorrel, whose leaves age to a beautiful vivid scarlet, and purple bell heather.
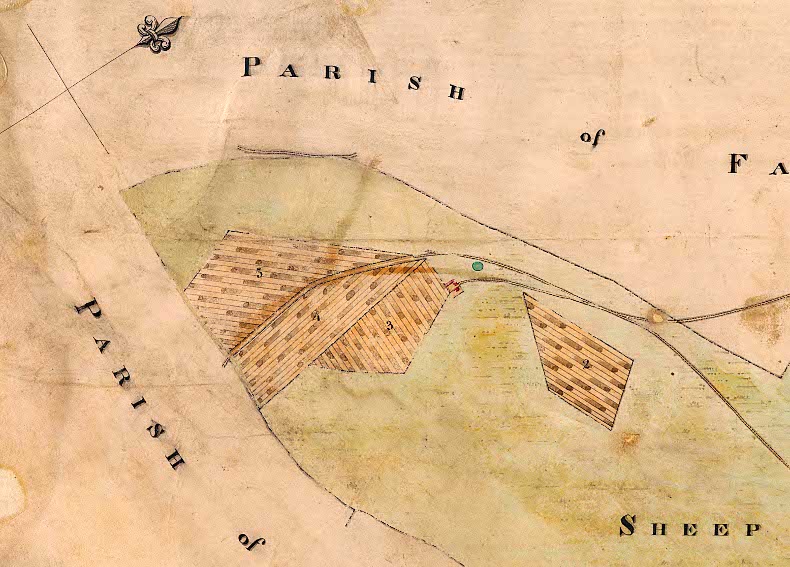
Over recent decades ploughs have become more powerful, with soil erosion on the South Downs recorded as being up to 200 cubic metres per hectare per year. This (if my calculations are correct) would equate to up to 2cm loss per year. Therefore, in a worse case scenario, the Newmarket Hill could shrink in height by 2 feet in just 30 years. Newmarket Hill has been under the plough for about two hundred years (a map dated 1830 showed it as ‘broken up’, i.e. ploughed).
For a technical paper on the subject see: Soil Erosion and Flooding on the Eastern South Downs, Southern England, 1976-2001, John Boardman, Transactions of the Institute of British Geographers, Vol. 28, No. 2 (Jun., 2003), pp. 176-196. Published By: Wiley https://www.jstor.org/stable/3804444.
